It’s always fun to bend Tableau into doing things it’s not really intended to do. One of the things that makes Tableau different then other more traditional reporting tools is it doesn’t natively support pagination of data. I say natively because as we’re about find out, there are ways of doing creating a “pages” user experience. But like most things in Tableau, it has a limit before performance begins to be sacrificed.
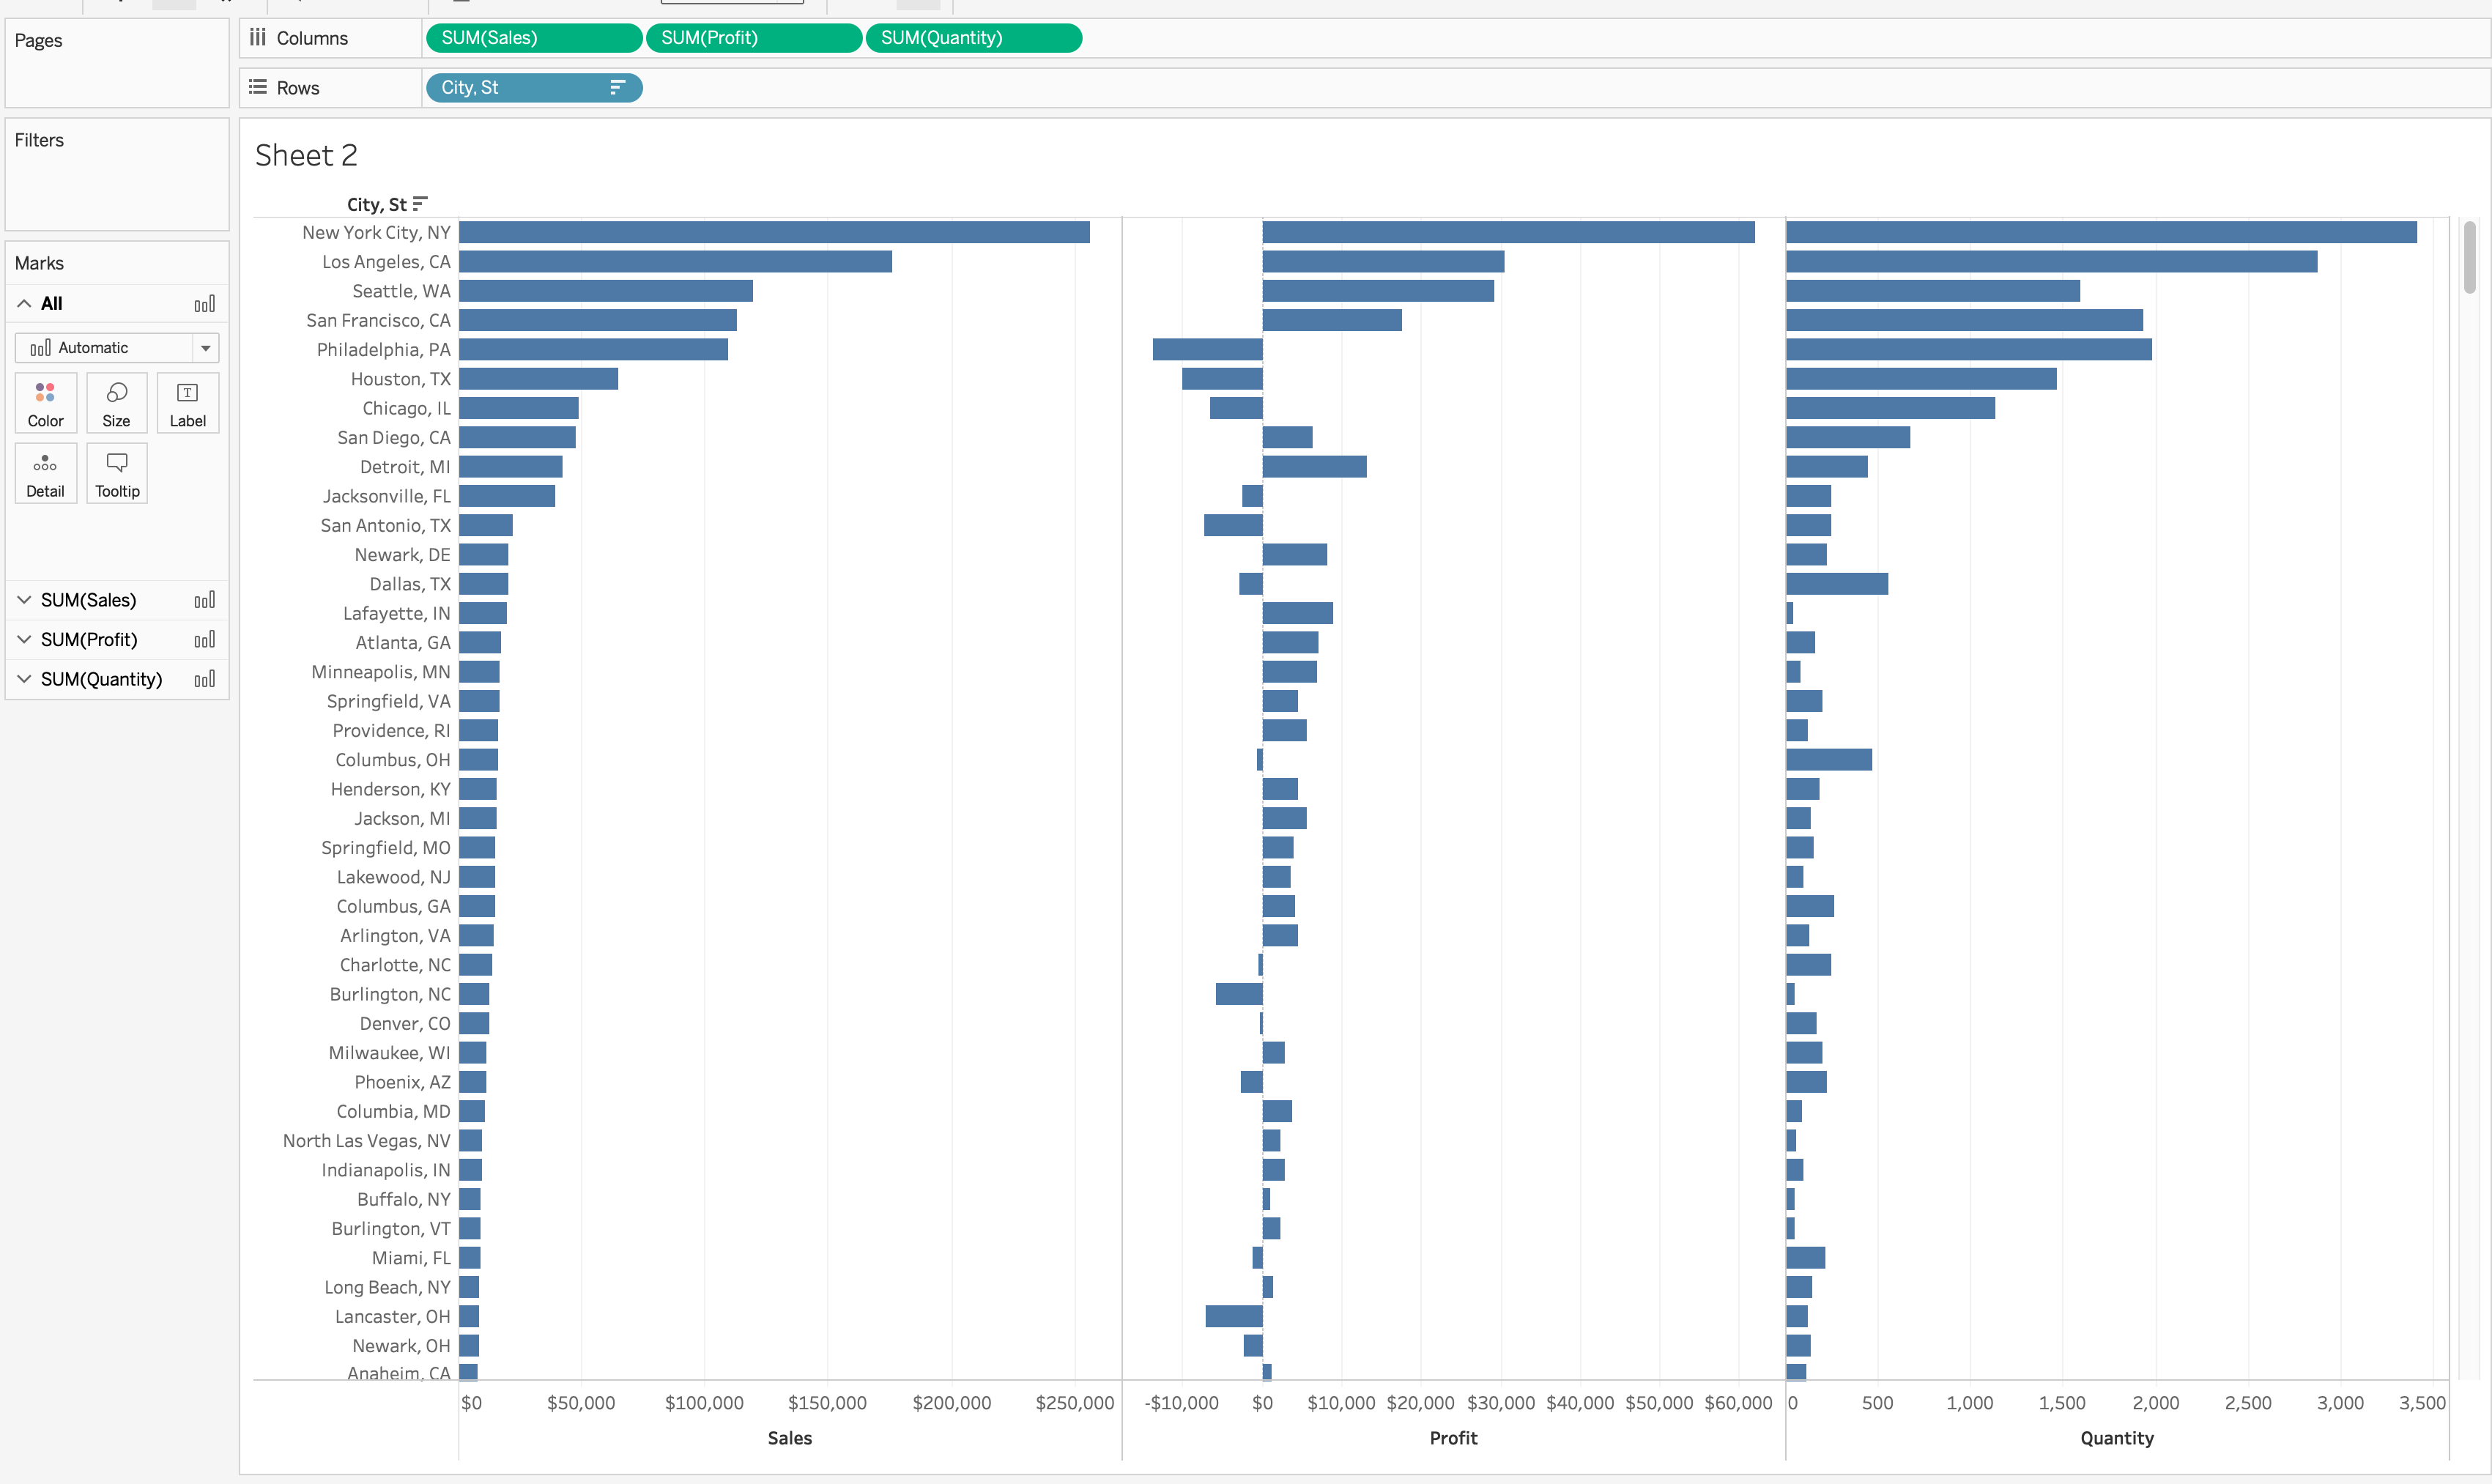
But if your dataset is relatively small then this might be an option for you. Ready to get started? Here’s the challenge (click the screenshot hyperlink to the challenge):

The visual for this challenge is super simple. Which is good because we can focus our efforts on the user experience and figure out a way to create a page for every 10 rows of data, how to fix the axis without hardcoding the axis and finally how to add a zero line for profit only.
Luke was kind enough to provide the case statement to add the state abbreviations. After we create the [City, State] field let’s add it to rows and then let’s add each measure to columns and sort descending by [Sales]
Great! And the foundation is set.
Now, we can see from the final dashboard that we are going to be partitioning/binning/bucketing/pick your verb every 10 rows of this table. So let’s start by adding an index so that we can see the number for each row
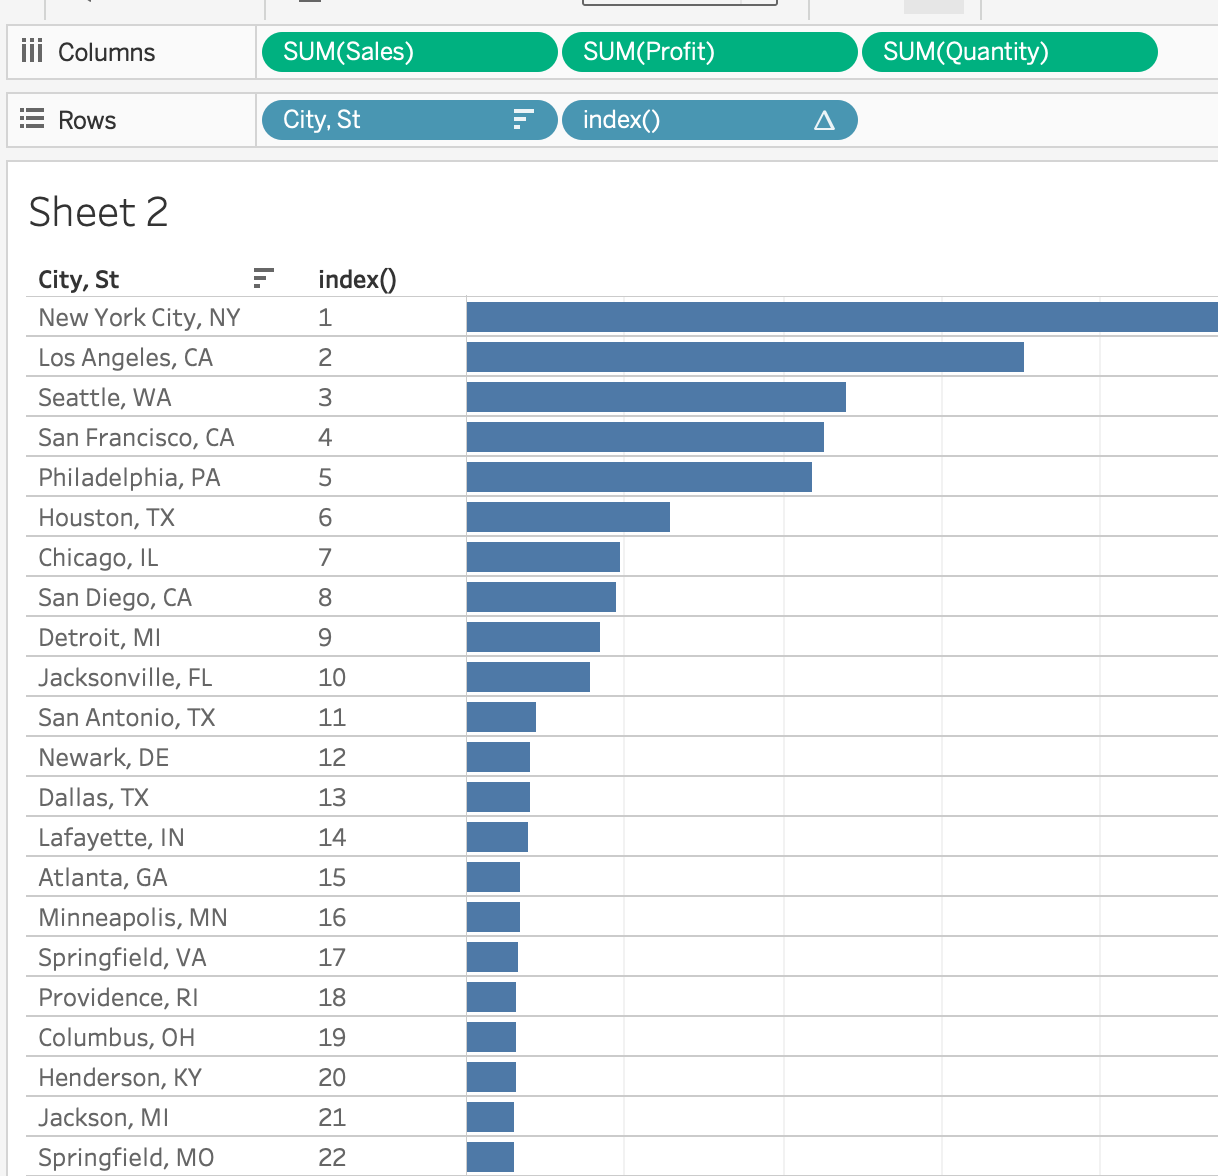
My first instinct from this point was to take the first digit of each number and use that as the bucket grouping but since my index() is a number, I don’t have a leading zero which I need for this solution. But we can get our leading zero if we cast our index() as a string and add an leading zero if the length of the index() equals one. That can be accomplished with this calculated field
# Index with Leading Zero #
IF LEN( STR( INDEX() ) ) = 1
THEN “0” + STR( INDEX() )
ELSE STR( INDEX() )
END

Awesome! Now, I just need to grab the first digit from this new field but only if the length of it equals 2, if the length is 3 then I need to grab the first 2 digits and so on. However, there’s still one thing I need to do in order to get this just right. See the 10th line? It’s first number is 1 but per the instructions I need it to be grouped with the rest of the single digit rows. And the 20 needs to be grouped with the teens and so on.
I can get around this simply by offsetting the index() by -1. So I can modify my calculation above like this:
# OFFSET Index with Leading Zero #
IF LEN( STR( INDEX() -1) ) = 1
THEN “0” + STR( INDEX() -1)
ELSE STR( INDEX() -1)
END

Awesome, now I just need to grab the first digit if the length of that field is two characters, the first two digits if the length is three characters and so on.
#First 2 digits#
IF LEN ( [OFFSET index with leading zero] ) <= 2
THEN LEFT ( [OFFSET index with leading zero] , 1 )
ELSEIF LEN ( [OFFSET index with leading zero]) = 3
THEN LEFT ( [OFFSET index with leading zero] , 2 )
ELSE LEFT ( [OFFSET index with leading zero] , 3 )
END

YES! Alright I think we’re ready to add the parameter. Here are a couple really cool things about parameter:
- You can alias parameter values
- You can paste a list of parameter values and aliases from your clipboard
We’re going to use both of those in the next step, but first we need see what the max number is in our [First 2 digits] field. It’s 60. Now let’s open up our trusty, it-will-always-be-there-to-welcome-you-back-with-open-arms application; good ole MS Excel and let’s fill a column from 0-60, then set up columns C & D like this

Now in column B let’s add this formula and copy it down

Then copy everything in columns A & B only. Come back to Tableau, create a parameter as a string and add a list of values but simply click “Paste from Clipboard” and watch Tableau do it’s magic!

Now all we have to do if write a boolean calc to evaluate if the parameter value is equal to a member of the [First 2 digits] field.
#Pagination#
[First 2 digits] = [Select cities by rank]
Now let’s put this new field on the filter card and set to TRUE.
And…

BOOM!
Now we can remove our extra index calcs from rows, format our bars to the red color defined in the instructions. Add mark labels and remove column dividers, gridlines and zero lines
Zero Lines? But I thought it said we needed one for profit? Yep, we do but we fake it with a reference line for that marks card only.
#Profit zero line#
Min( 0 )
And now we can format it to look like a zero line by selecting a gray color and small dotted line.
Now we can test that our parameter is working
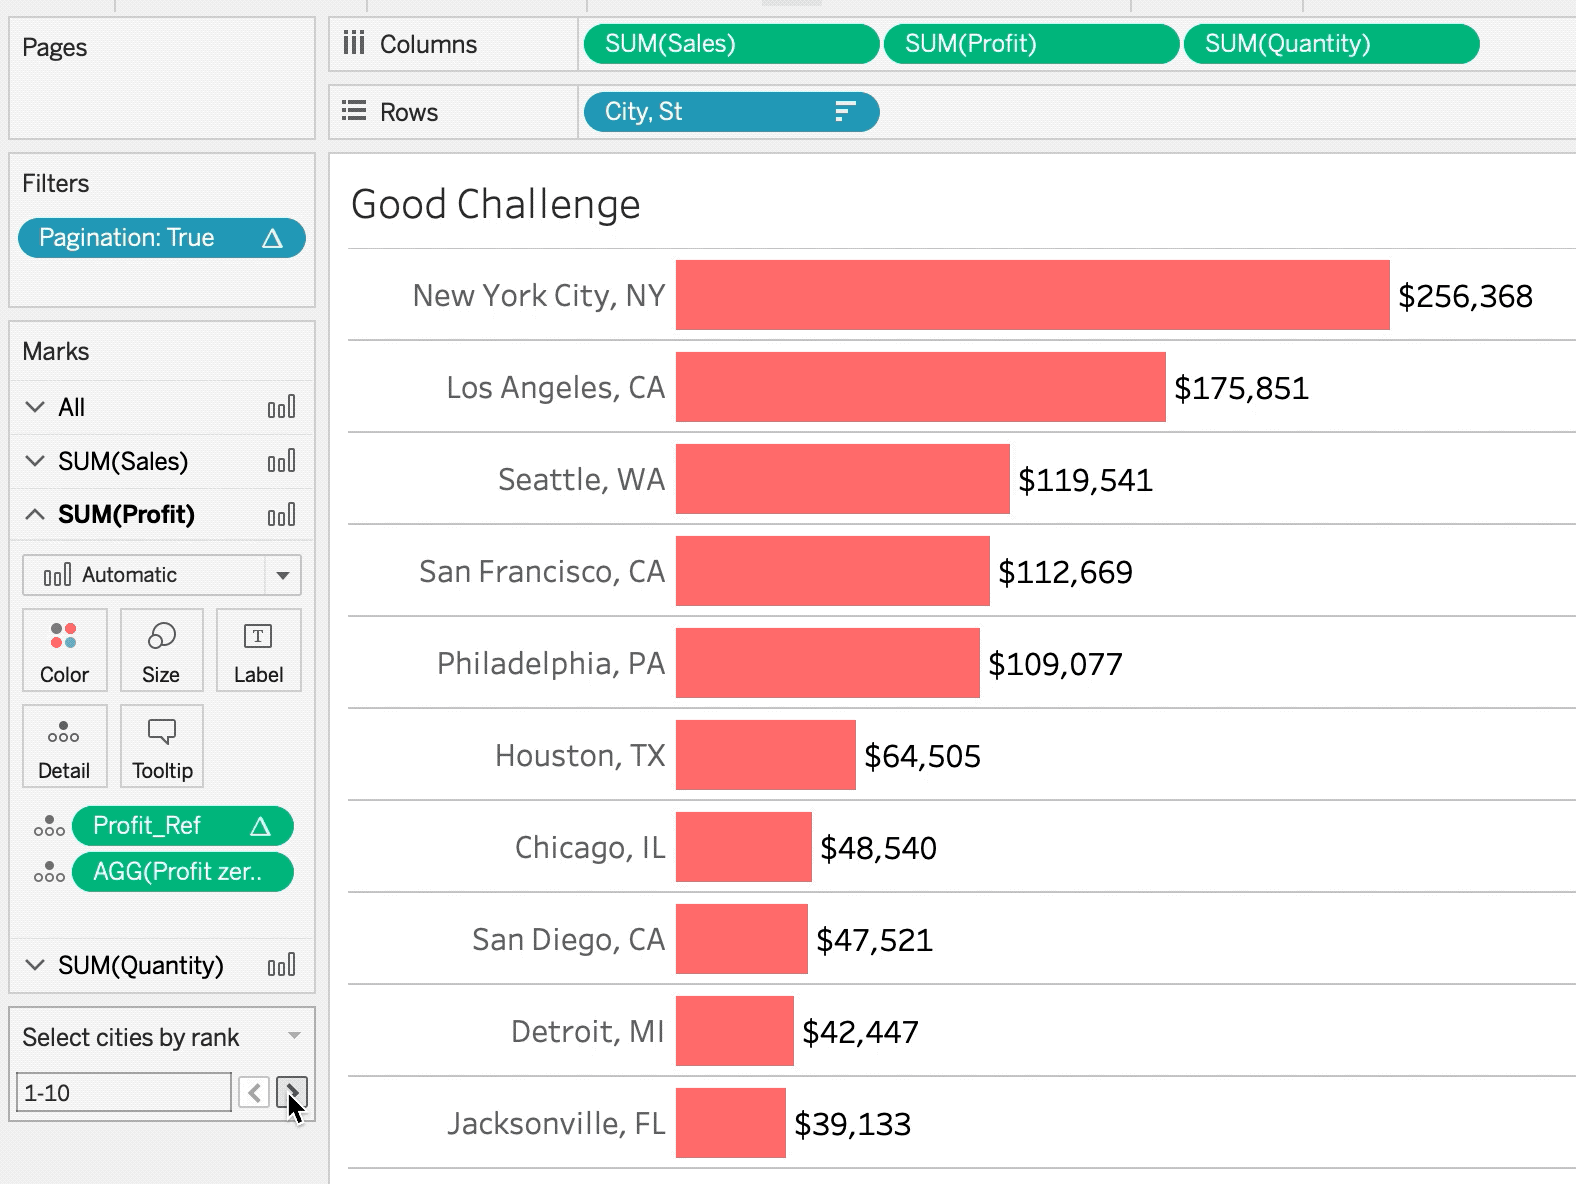
Awesome! But now we need to fix the axes to our bar lengths relative to the rest of the rows regardless of which page we’re on.
This can be achieved again by using reference lines. We need to know what the max value is for each measure and then add a bit of white space. Then we can format it to be completely transparent. Thus fixing our axes.
#Sales_Ref#
TOTAL( MAX( [Sales] ) ) * 1.2
#Profit_Ref#
TOTAL( MAX( [Profit] ) )
#Quantity_Ref#
TOTAL( MAX( [Quantity] ) ) * 25
The multiplier values were the result of trial and error. But now we can put each of those on the detail shelf of the corresponding marks card.
And now…
Let’s put a bow on this thing by adding this to a dashboard and you are all set!